Nino Indices Crash: Early Dilution Of La Nina Likely


Key Takeaways:
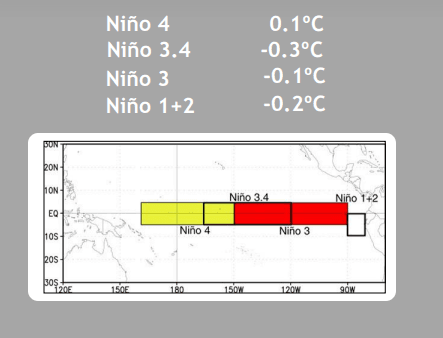
- All Niño indices have fallen below the ±0.5°C threshold, signaling weakening ENSO conditions.
- Niño 3.4 has turned least negative since October 2025, hinting at a transition phase.
- IOD has turned sharply positive but remains unstable and unlikely to sustain.
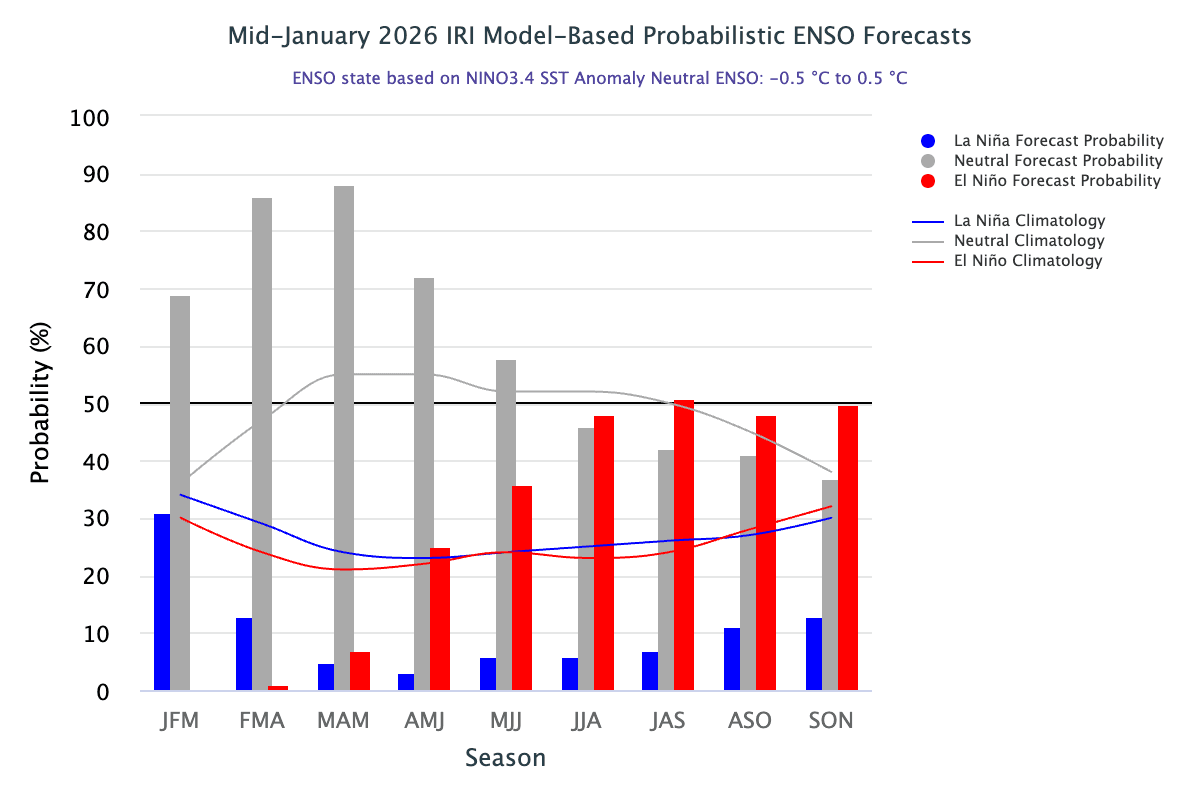
- ENSO-neutral conditions are expected to dominate early spring as La Niña weakens.
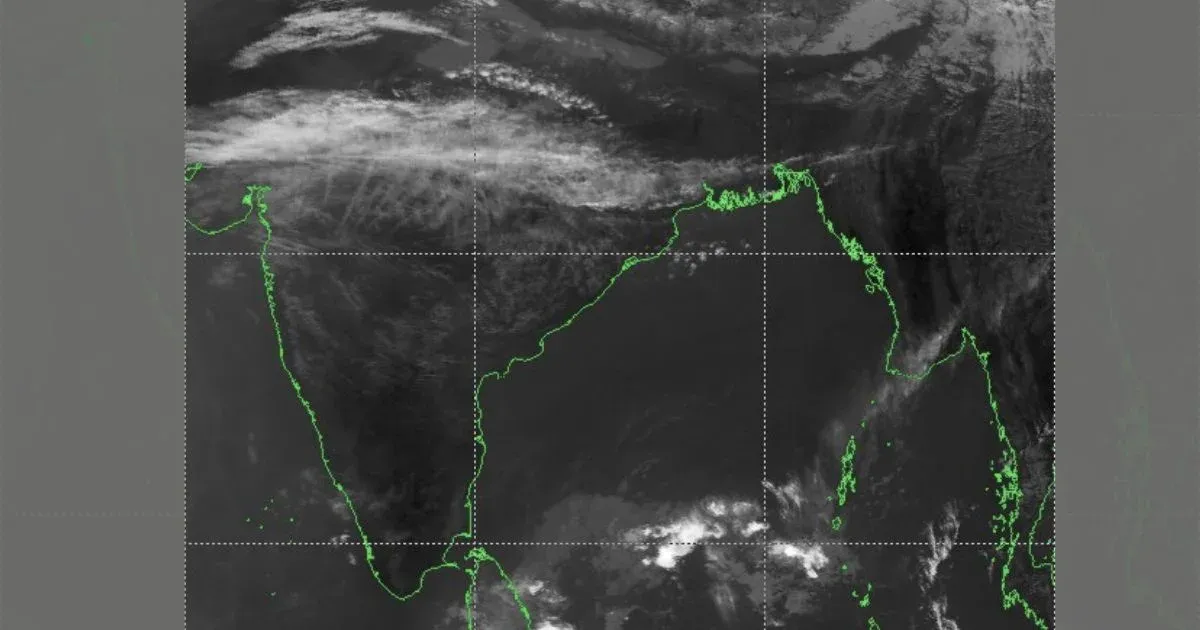
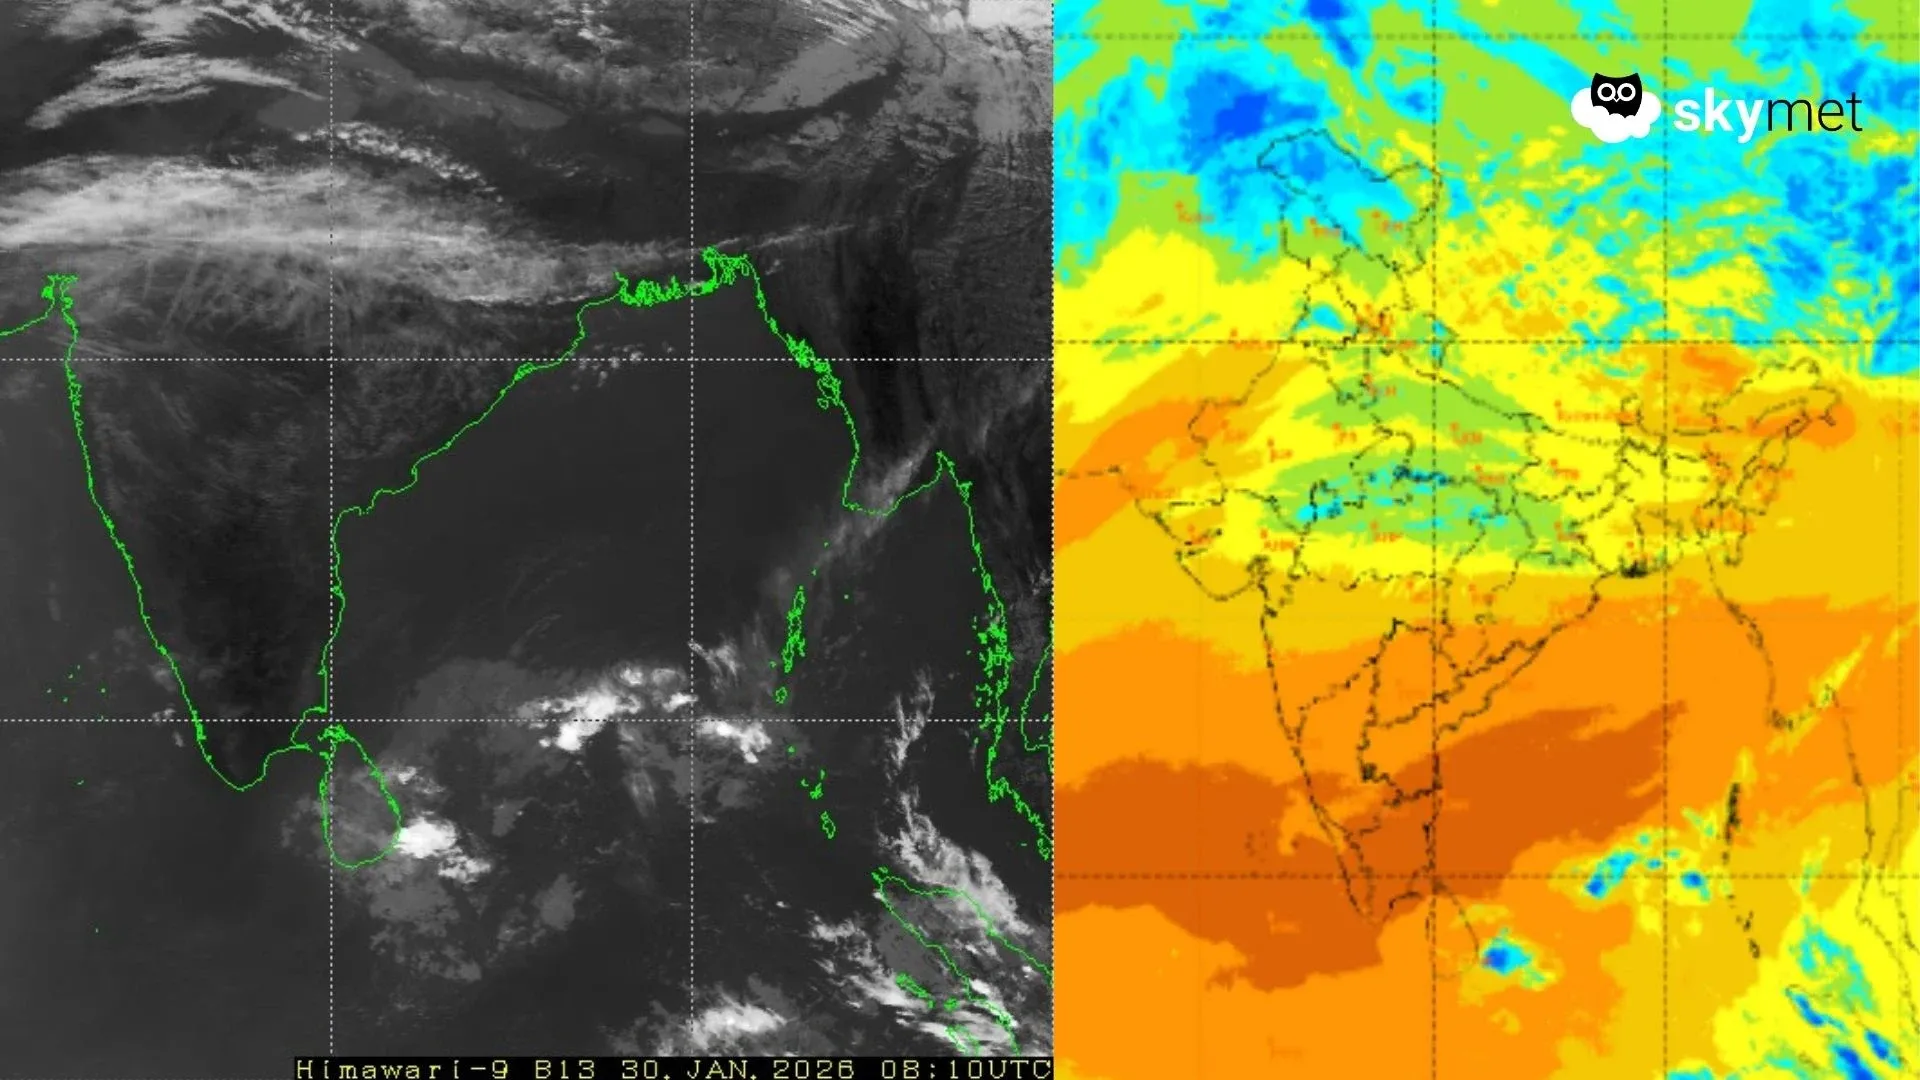
Sea surface temperatures are measured largely from space by radiometers, which detect the electromagnetic energy from light and heat emitted by objects and the Earth’s surface. In the case of oceans, satellite radiometers—such as the Advanced Very High Resolution Radiometer (AVHRR) on NOAA weather satellites and the Moderate Resolution Imaging Spectrometer (MODIS) on NASA’s Terra and Aqua satellites—detect the strength of infrared and microwave emissions from the top few millimeters of the water.
When deciding whether the Pacific is in an El Niño state, climatologists at NOAA examine sea surface temperatures in the east-central tropical Pacific Ocean, referred to as the Niño 3.4 region (120°–170°W). The Oceanic Niño Index (ONI) is based on SST departure from average in the Niño 3.4 region and is the principal measure for monitoring, assessing, and predicting ENSO. The ONI, in conjunction with other Niño indices, helps confirm whether there is sufficient ocean–atmosphere coupling for the sustenance of El Niño or La Niña.
ENSO: The tropical Pacific receives more sunlight than any other region on Earth, and much of this energy is stored in the ocean as heat. However, the spread of heat is not uniform. Due to salinity and other factors, the degree of warmth varies from east to west, north to south, and from the surface to deeper layers. This is why the four Niño indices have different values at any given time and rarely show a uniform distribution.
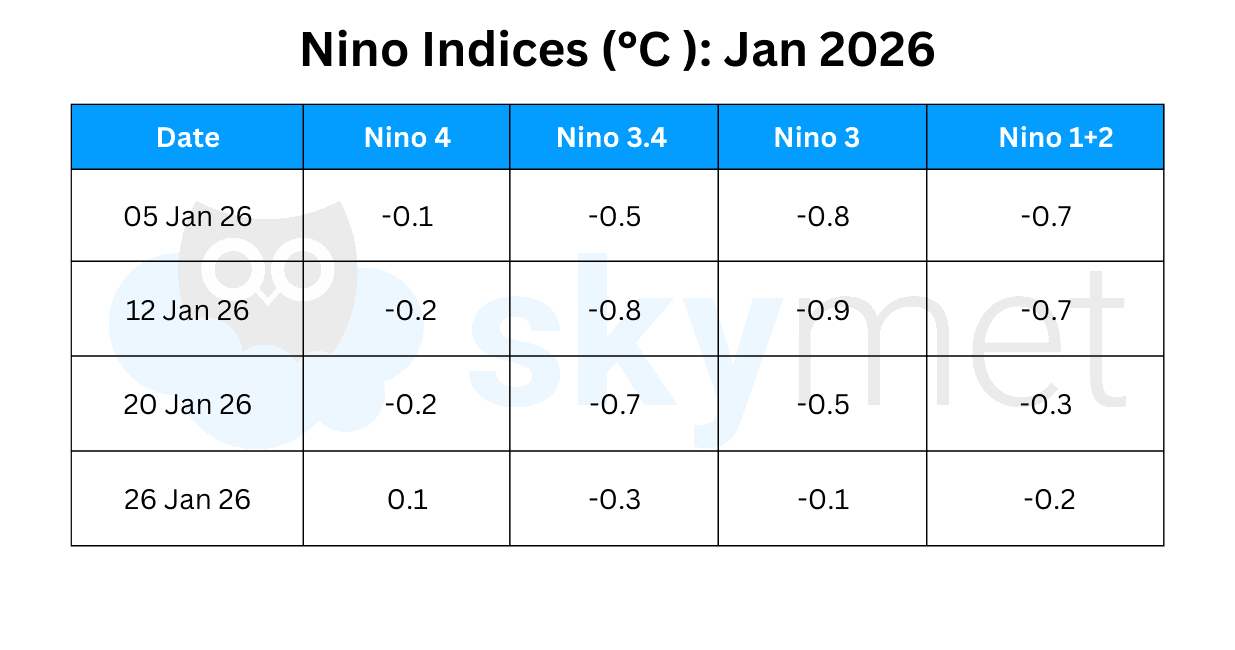
All four Niño indices have declined sharply this week and are now below the threshold mark of ±0.5°C. The index has shown a noticeable rise in the Niño 3.4 and Niño 3 regions. Niño 3.4 has recorded its least negative value since October 2025. The latest value for the week ending 26 January 2026 stands at −0.3°C.
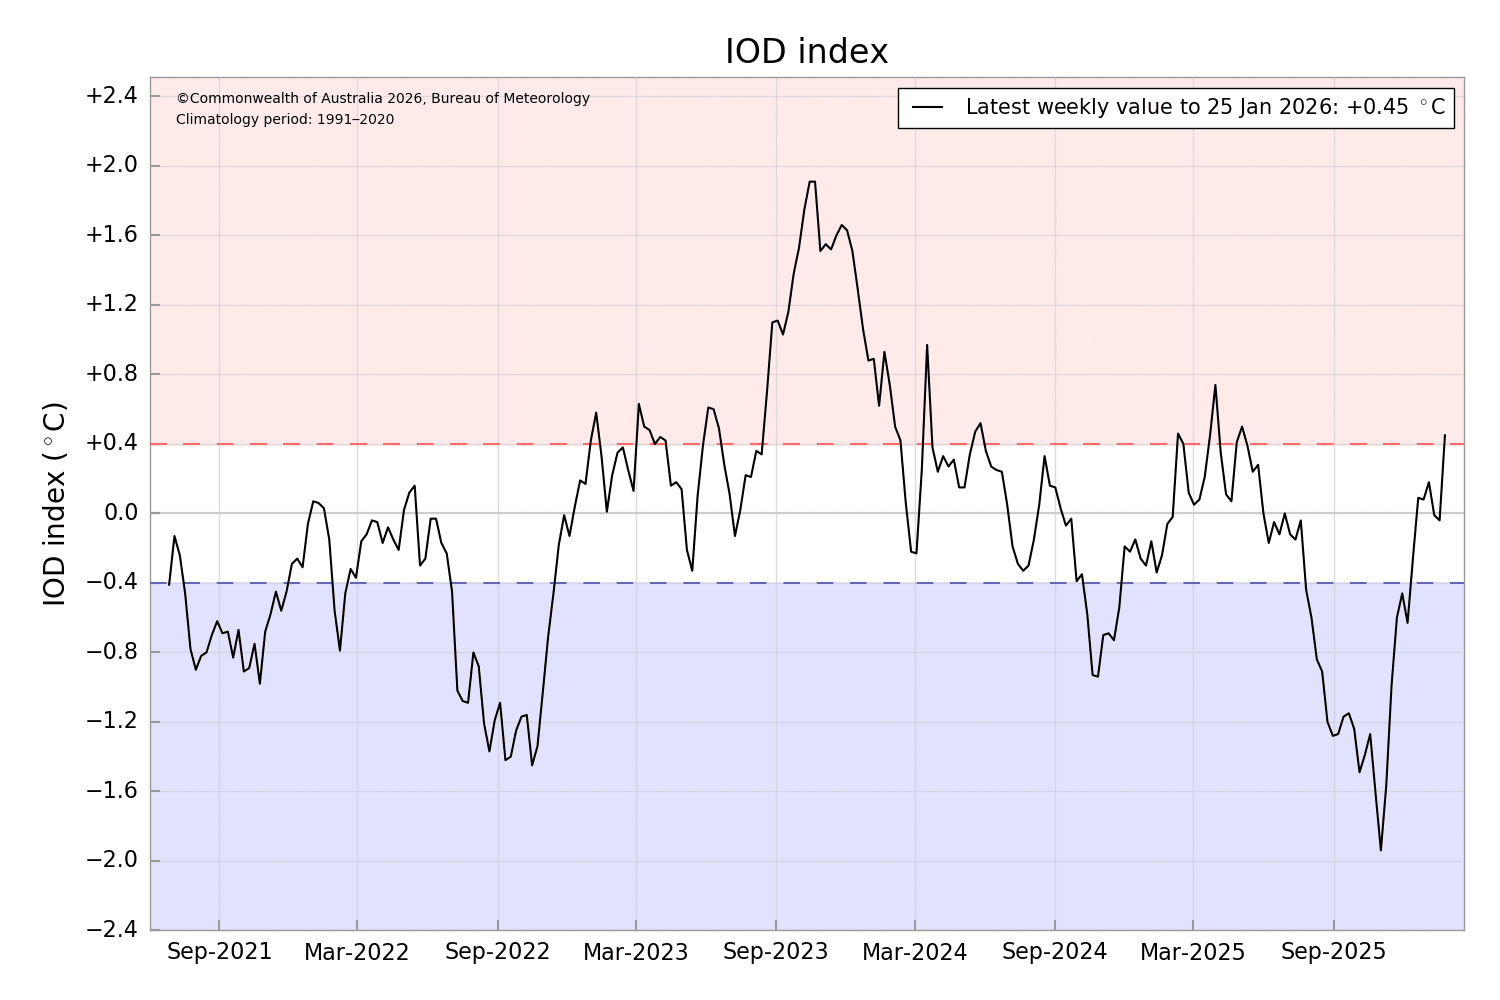
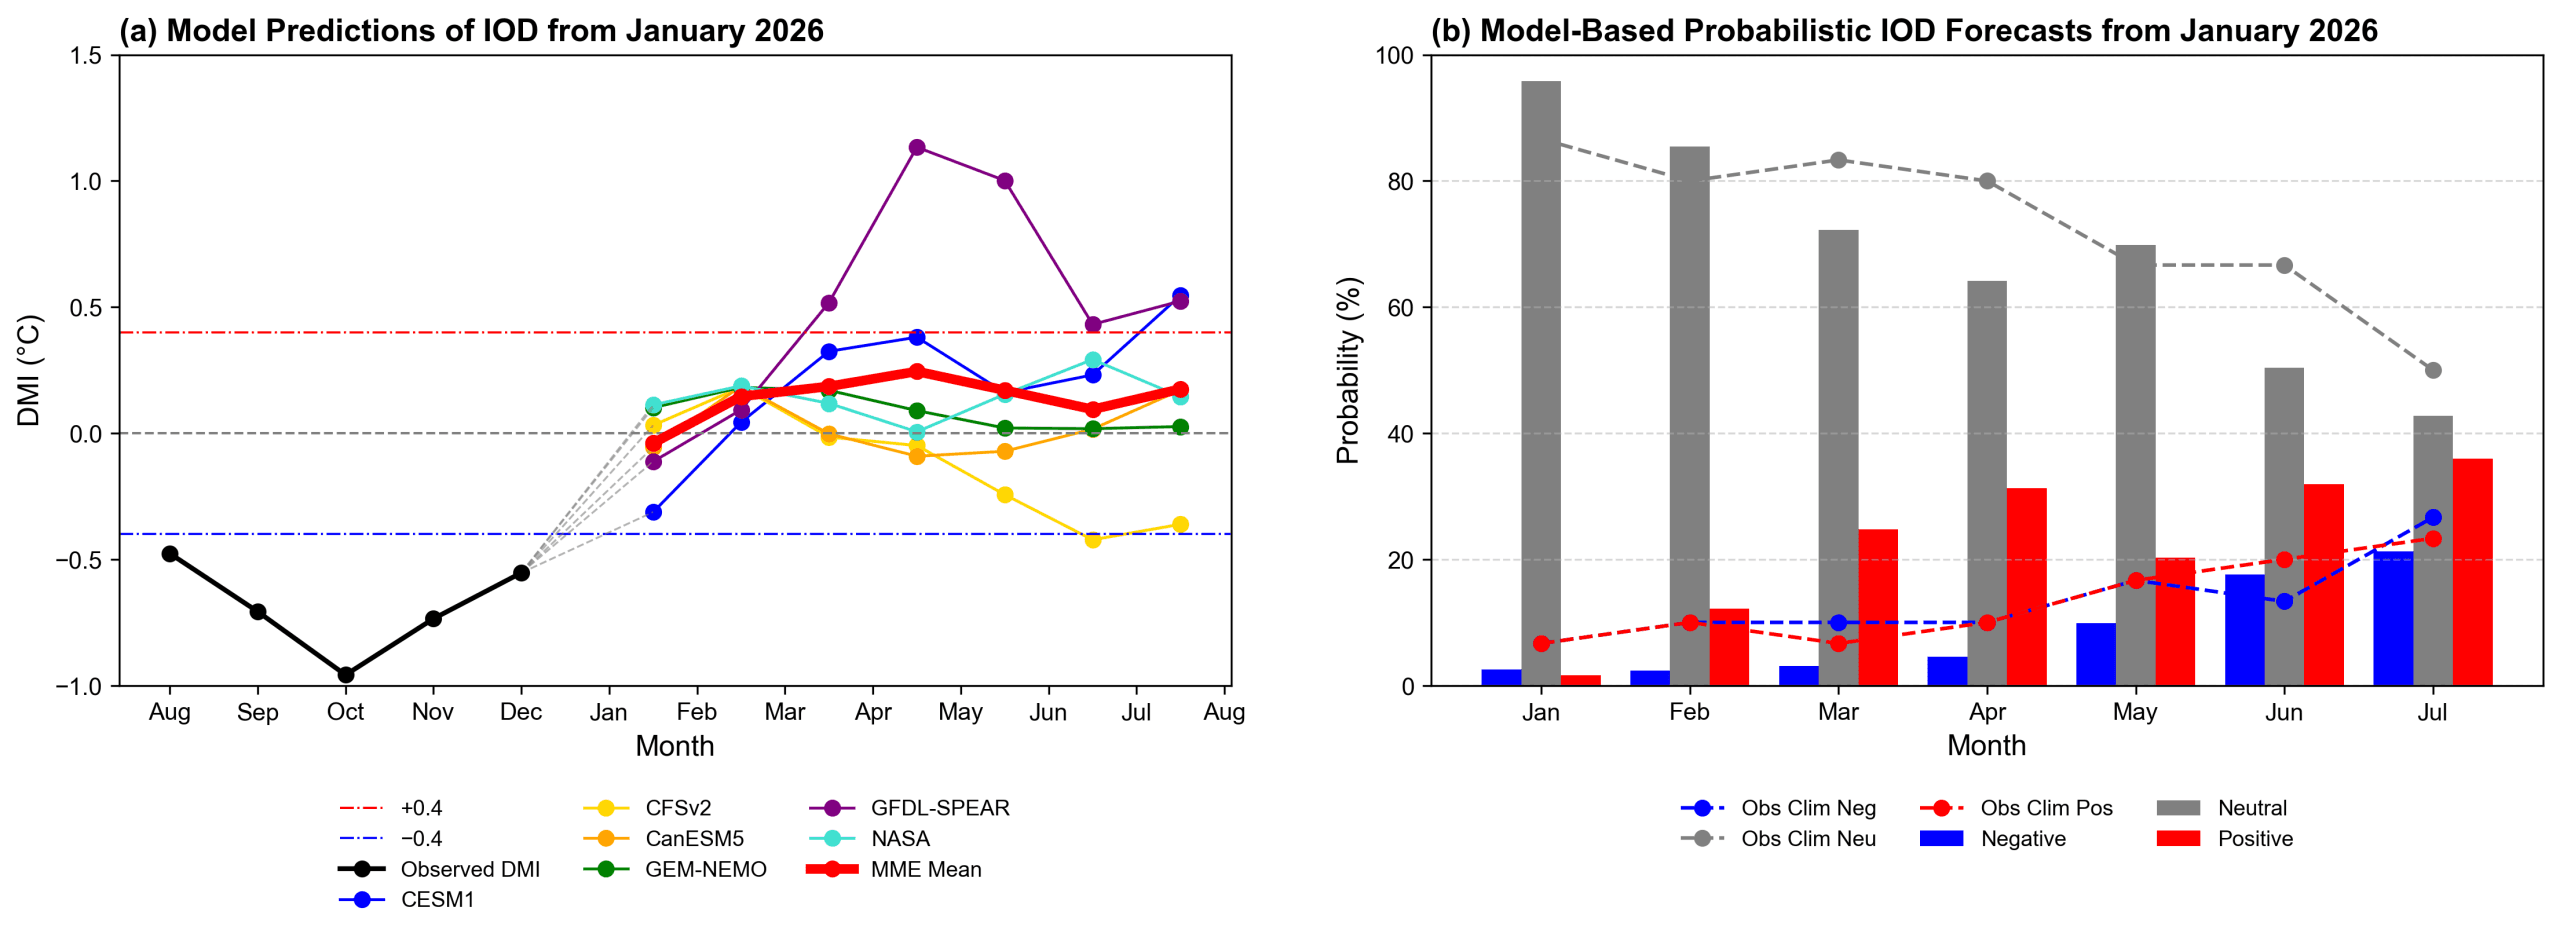
IOD: The Indian Ocean Dipole has been oscillating around the threshold mark. Large fluctuations were observed over the last weekend, and the index has now turned distinctly positive. The Dipole value for the week ending 25 January 2026 was +0.45°C, the highest positive reading since May 2025. Such sharp variations suggest that the index lacks stability and may not sustain this level of warming over the western Indian Ocean. Most models indicate that the January–July outlook is likely to be dominated by neutral conditions.
MJO: Due to destructive interference, the RMM signal is expected to weaken. While moving eastward relatively quickly, the MJO pulse may retreat back into the unit circle. The GEFS indicates a weak and stagnant signal over the next few weeks. The ECMWF, however, suggests continued propagation during the next two weeks before stalling over the central Indian Ocean.
Niño indices remain vulnerable to large fluctuations. The spring barrier, beginning as early as February, does not support a stable ENSO pattern. However, a La Niña collapse appears imminent, and ENSO-neutral conditions are likely to dominate during early spring in the Northern Hemisphere.